Plot the Covariance Matrix
You might wish to examine how the various parameters are correlated with each
other. You can do this by plotting the covariance matrix using
visualize.covariance():
import visualize
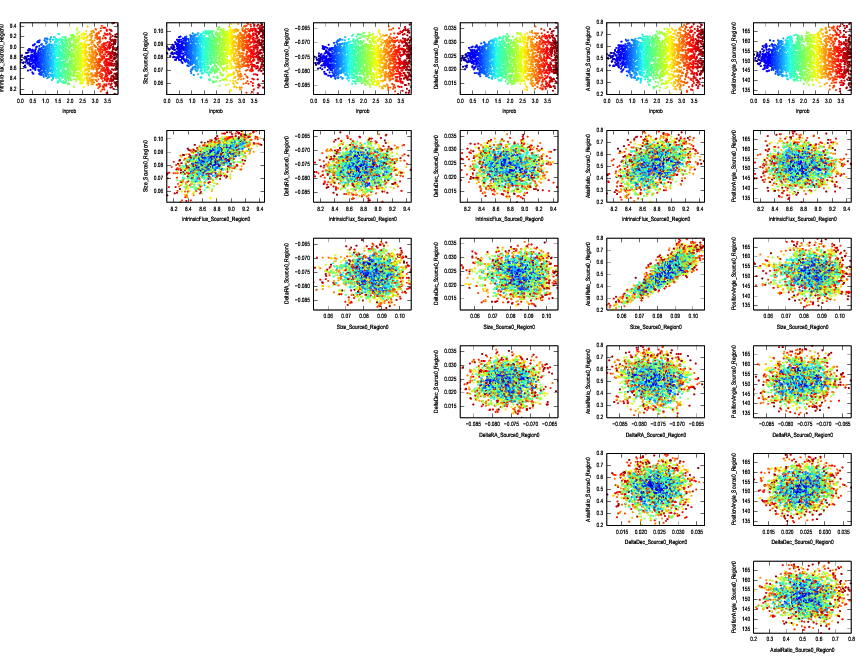
visualize.covariance()
This should produce a plot which looks similar to the image below. There appears to be a strong correlation between the axial ratio, size, and total flux density of the source.